From the recordings.

Real recordings, measured frequency curves, and candidate maps. Each figure shows a different part of the search; a high score alone does not establish a location.

Livermore, California

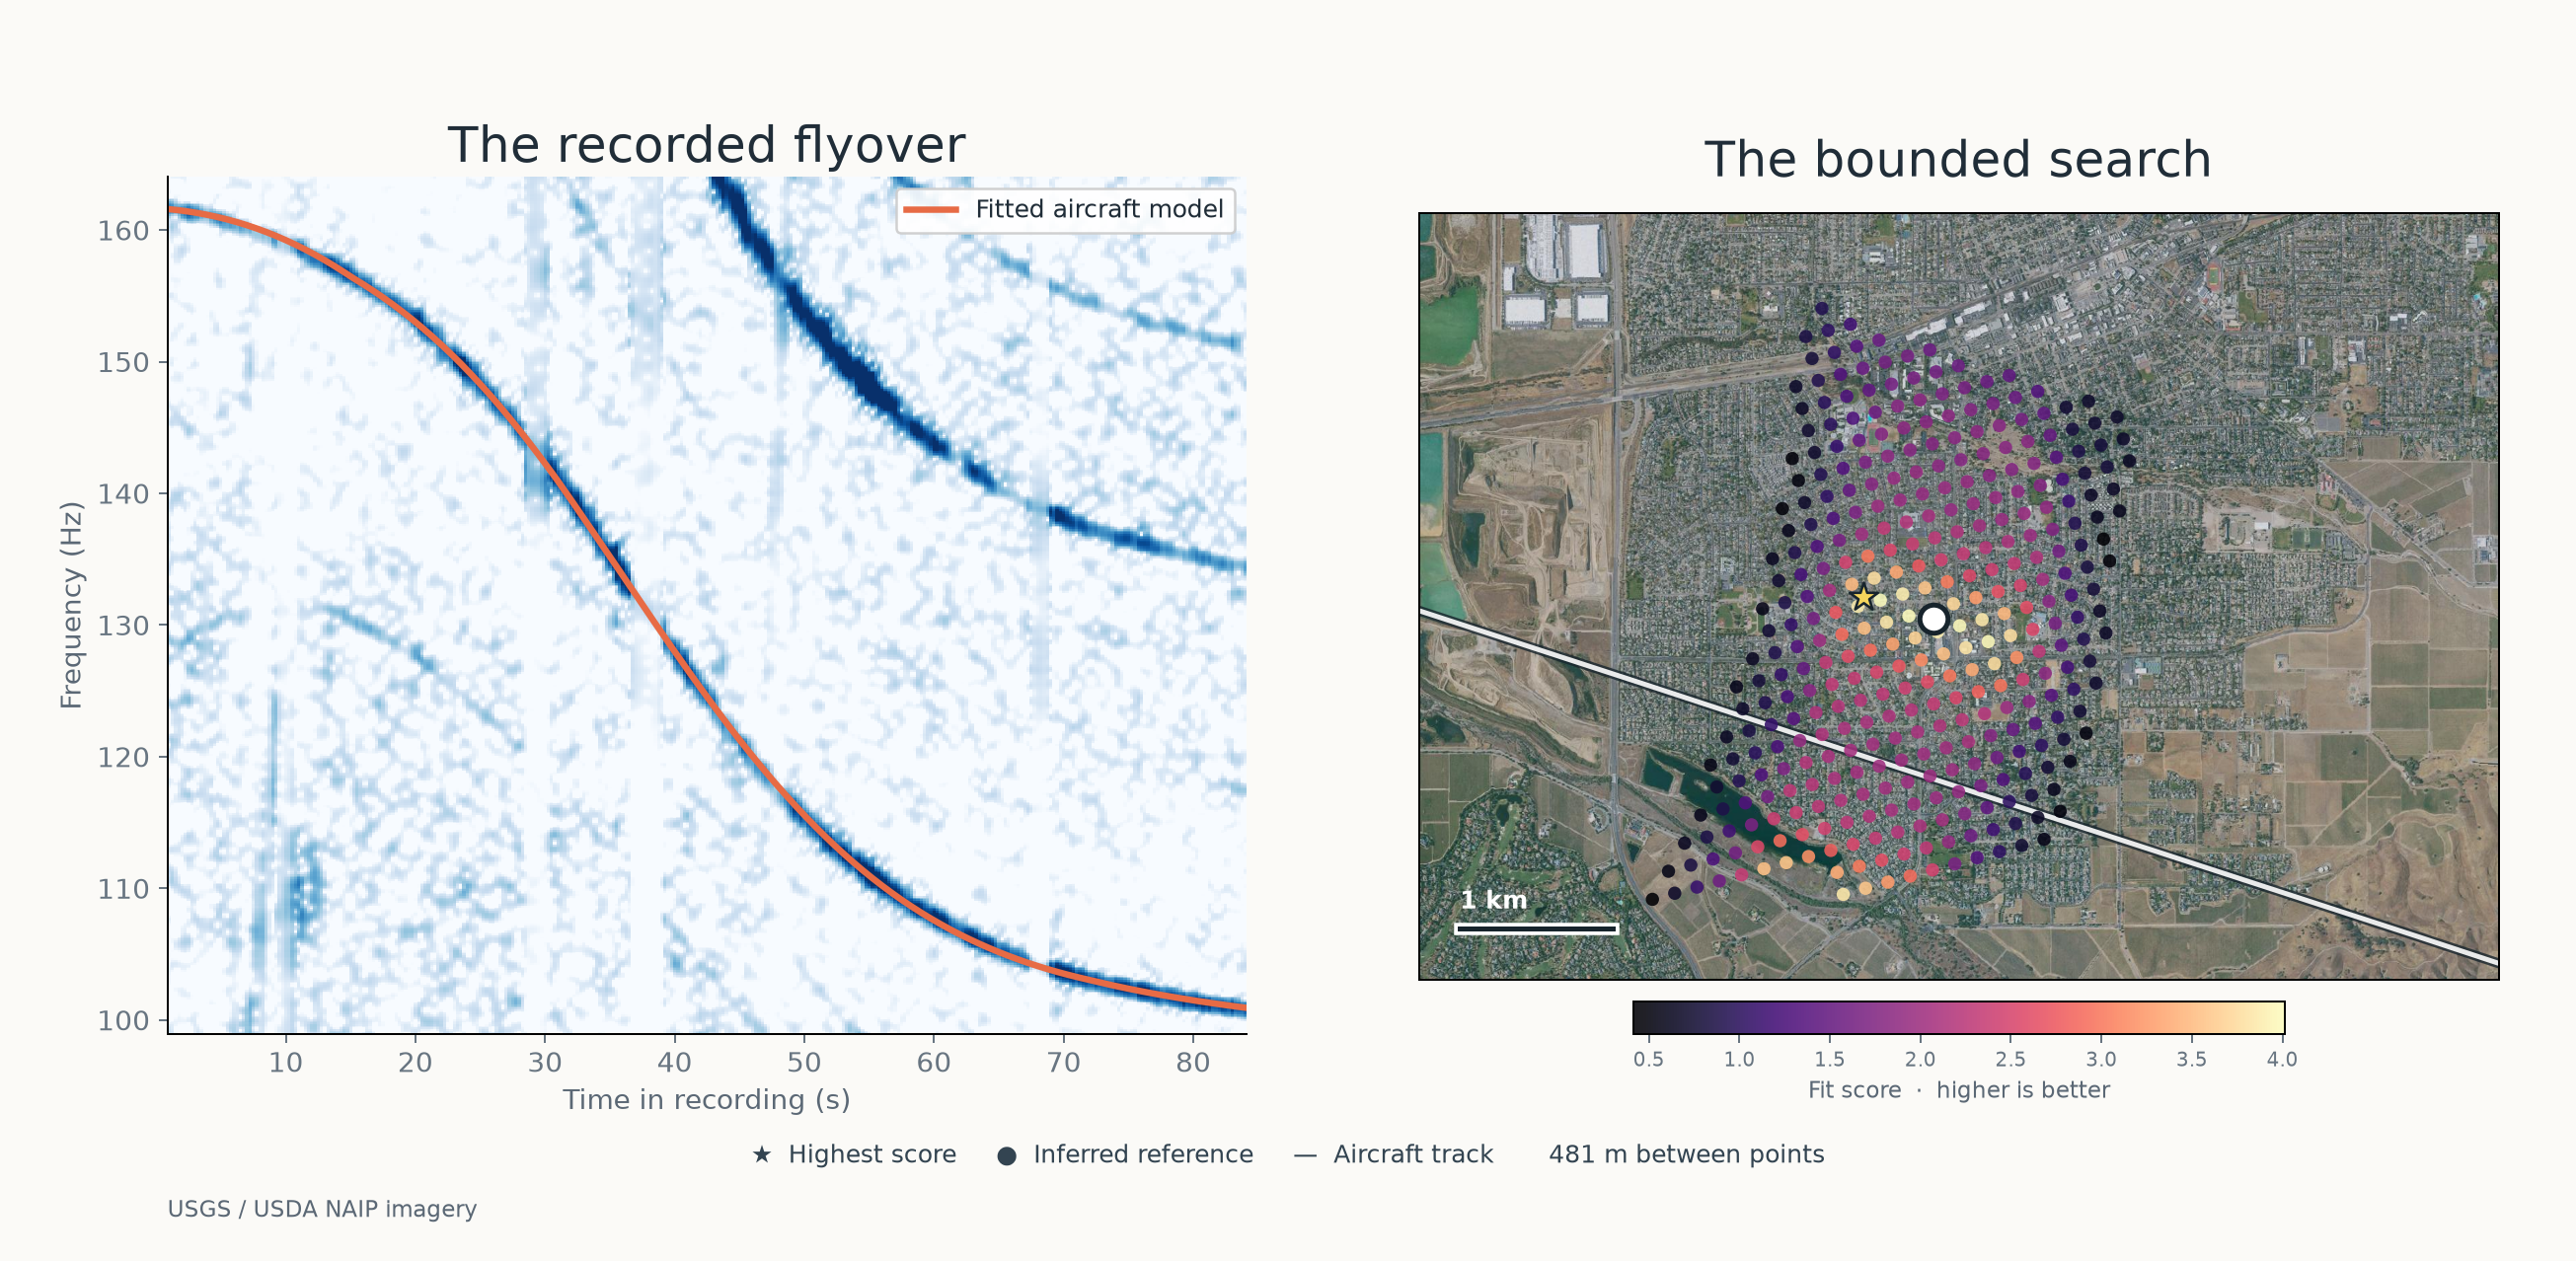
The automatic MP3 search and a configured run of the same recording. Both produced ranked candidates without accepting a location. Read the experiment.

Automatic MP3 search
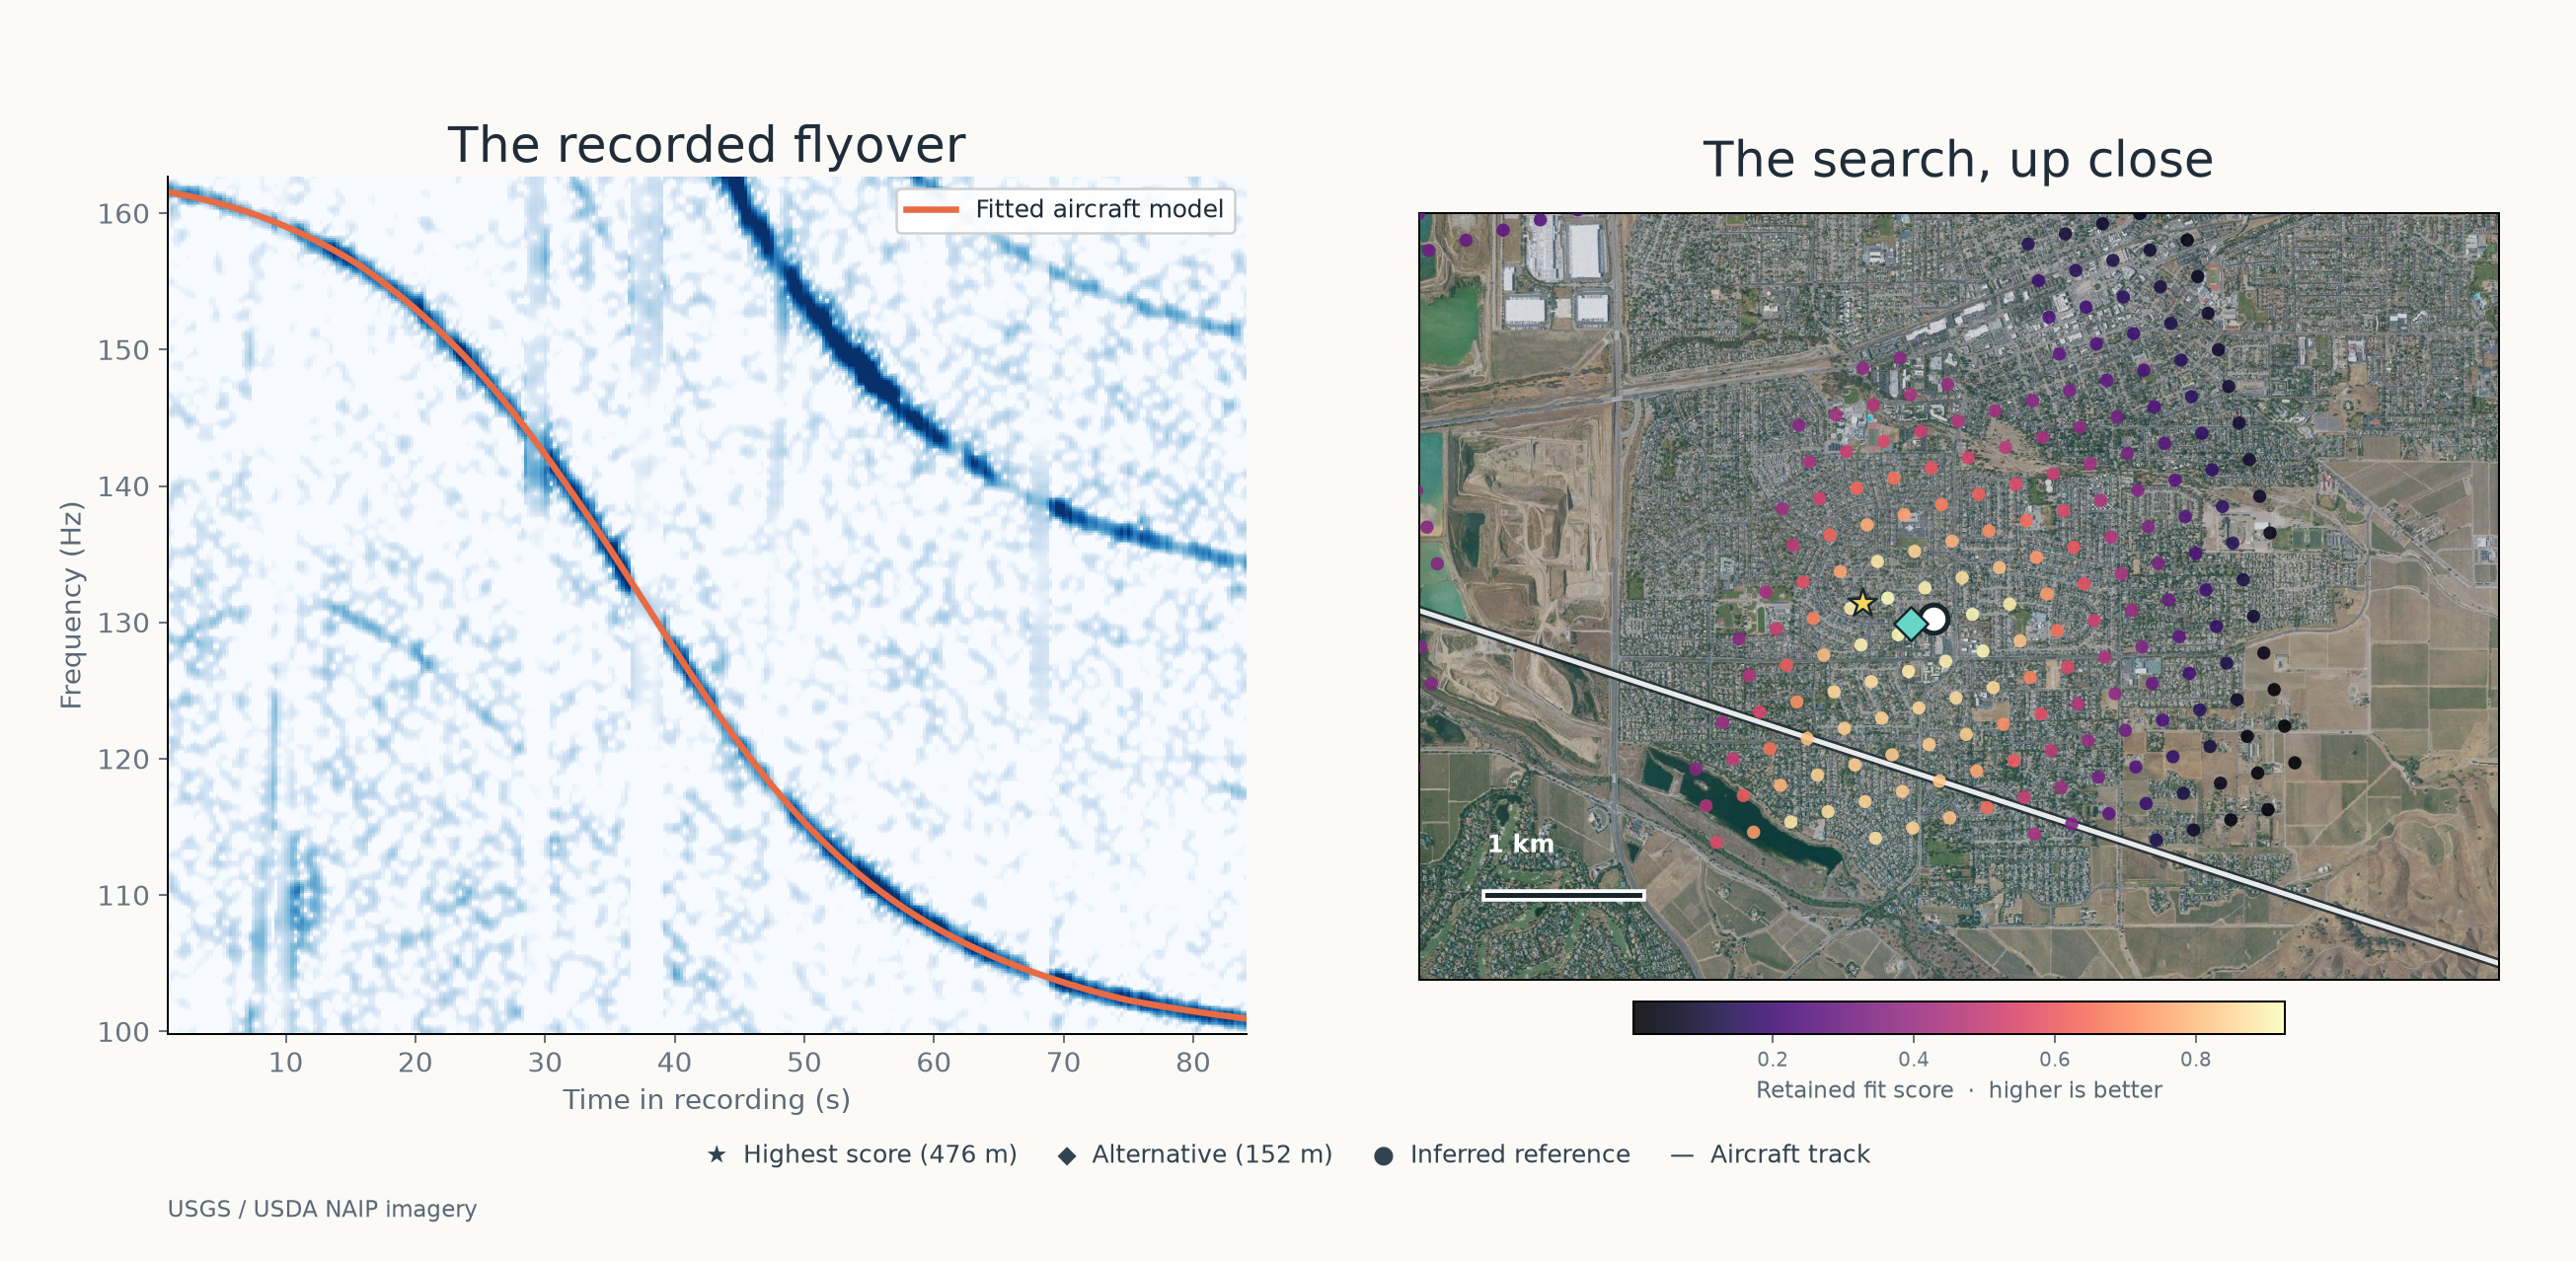
Automatic real MP3 analysis with the observed Doppler curve and ranked locations on a Livermore satellite map
Recorded audio and ranked candidates. The run remained inconclusive.
Configured search
Configured Livermore search showing a recorded flyover and a bounded map of candidate microphone positions
The same recording with configured event settings. No location was accepted.

Reading the frequency.

Measured tones and the aircraft models fitted to them.

The measured ridge
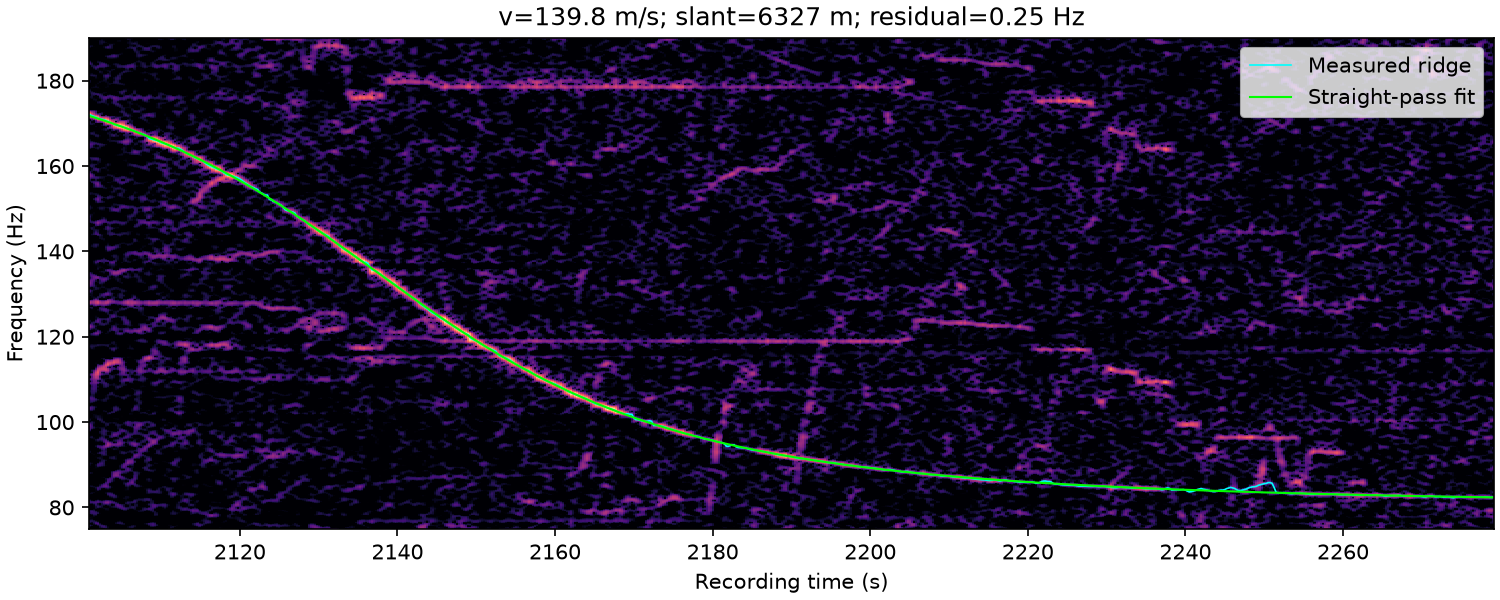
Recorded aircraft Doppler ridge and a fitted straight-pass curve
A moving tone in the recording, with a fitted straight-pass curve.
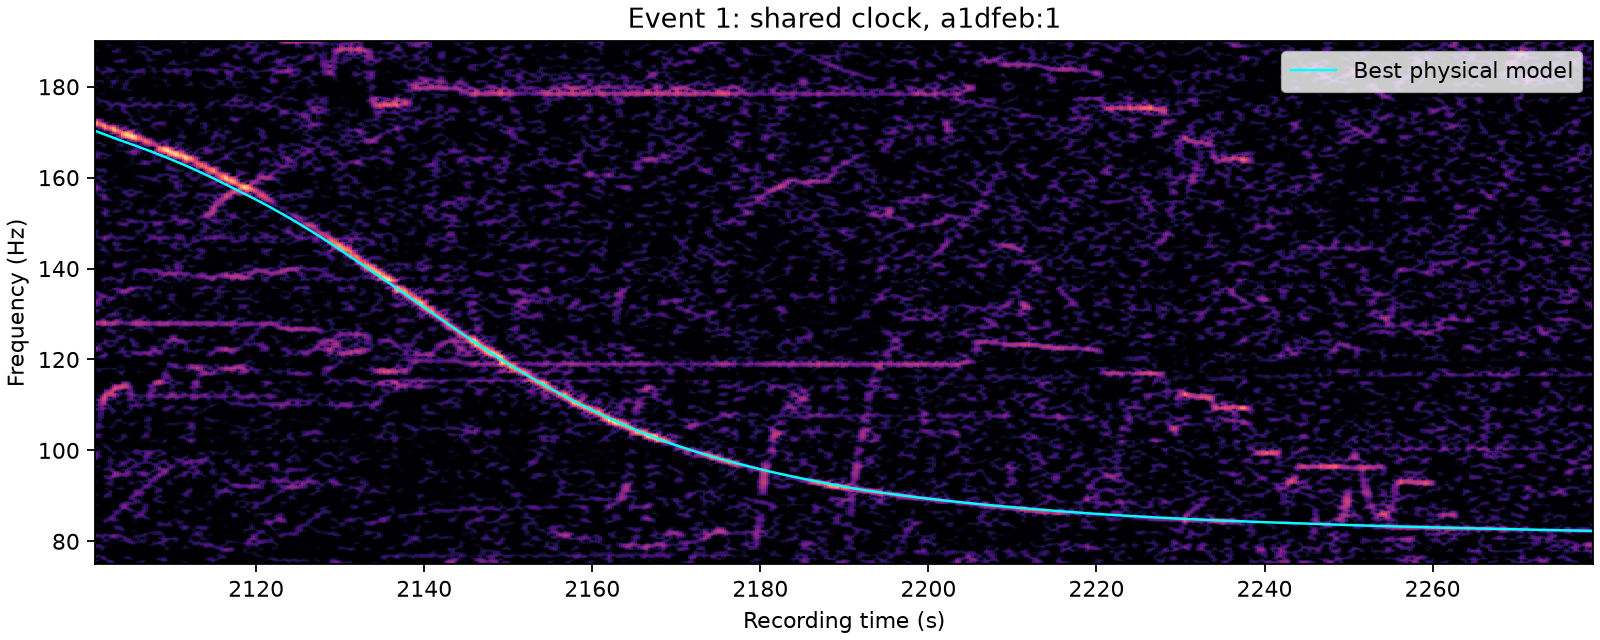
The flight-path model
Observed aircraft spectrogram with a best-fitting sound propagation model
A trajectory-based prediction over the recorded spectrogram.
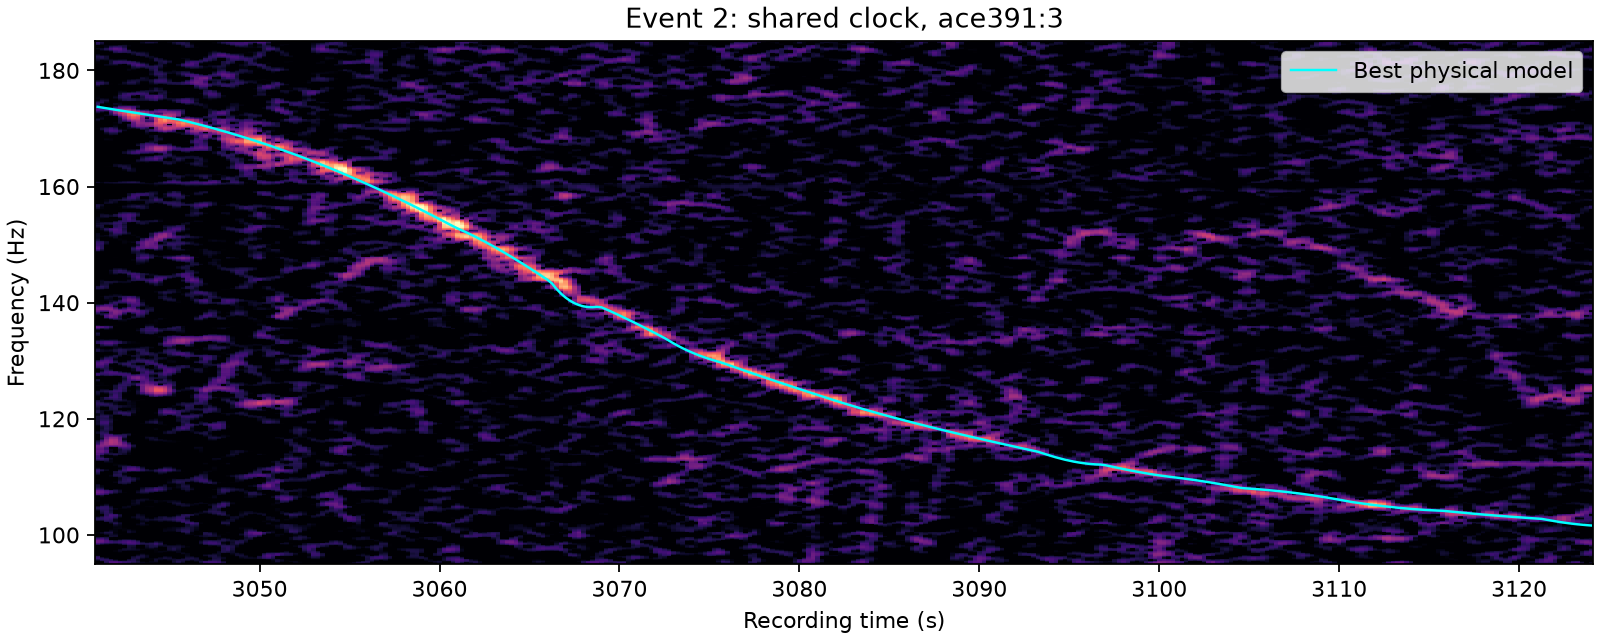
A second passage
Second recorded flyover with cyan Doppler model over the descending frequency ridge
A flight-path prediction laid over another recorded frequency ridge.

Finding the flyovers.

Automatic discovery across an entire recording, then a closer look at grouped acoustic traces.

Across the recording
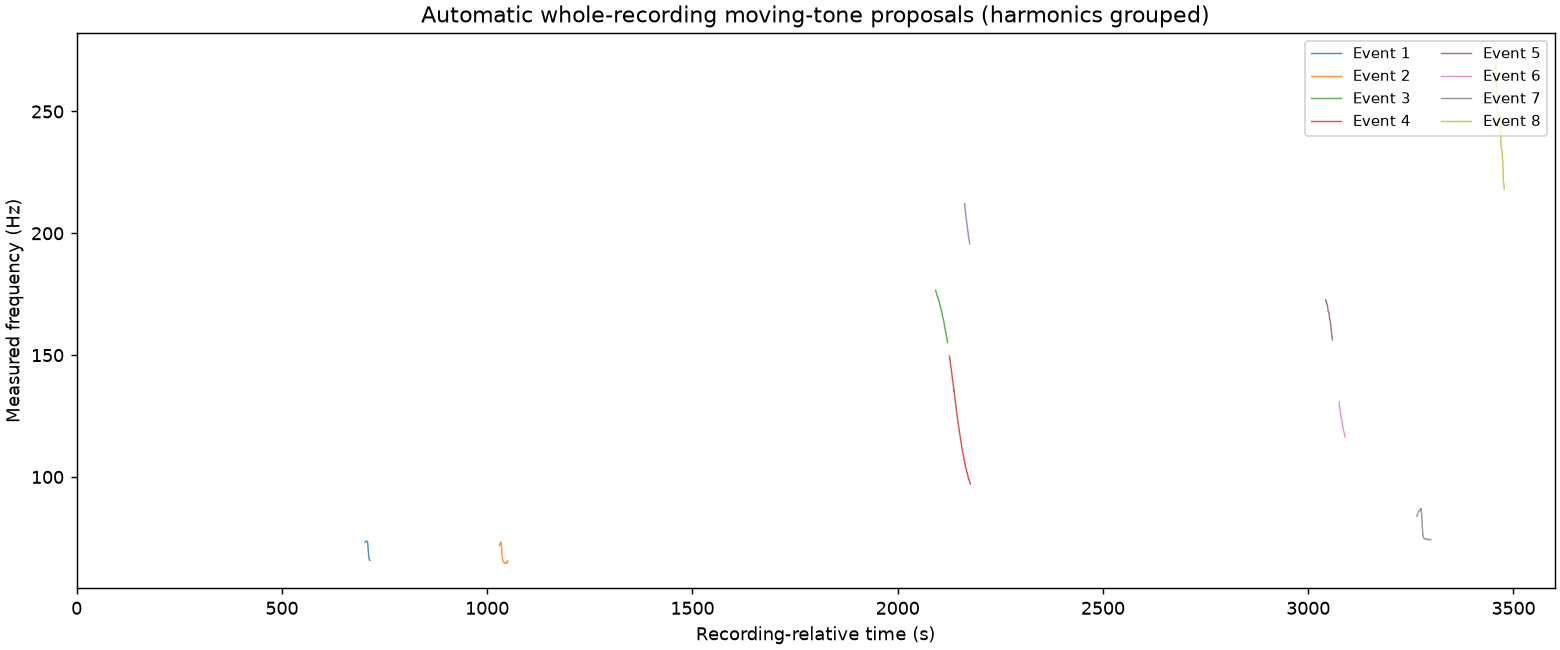
Whole-recording discovery showing candidate moving-frequency traces over recording time
Moving-frequency proposals found by the detector; proposals are not confirmed aircraft.
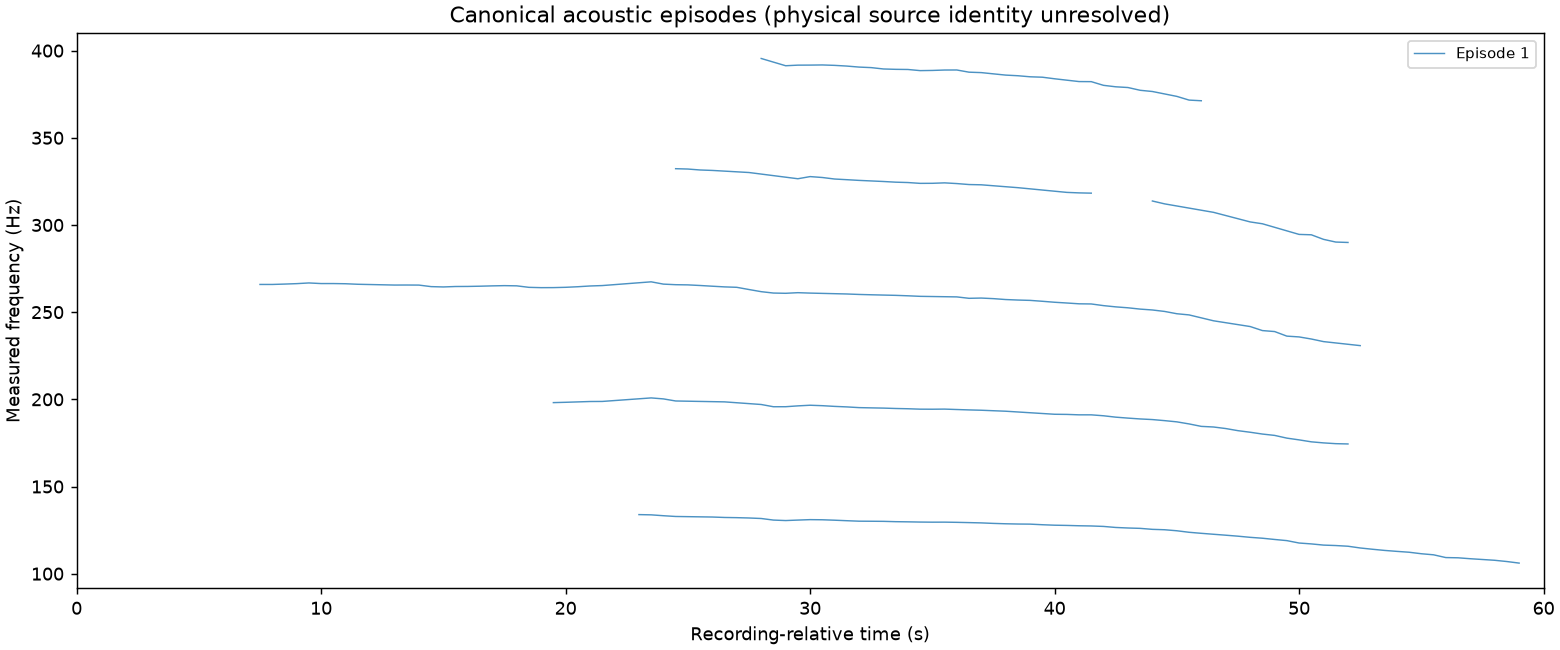
Grouping the traces
Frequency traces grouped into a canonical acoustic episode over 60 seconds
Related tones are grouped so harmonics do not count as independent flyovers.

Searching the map.

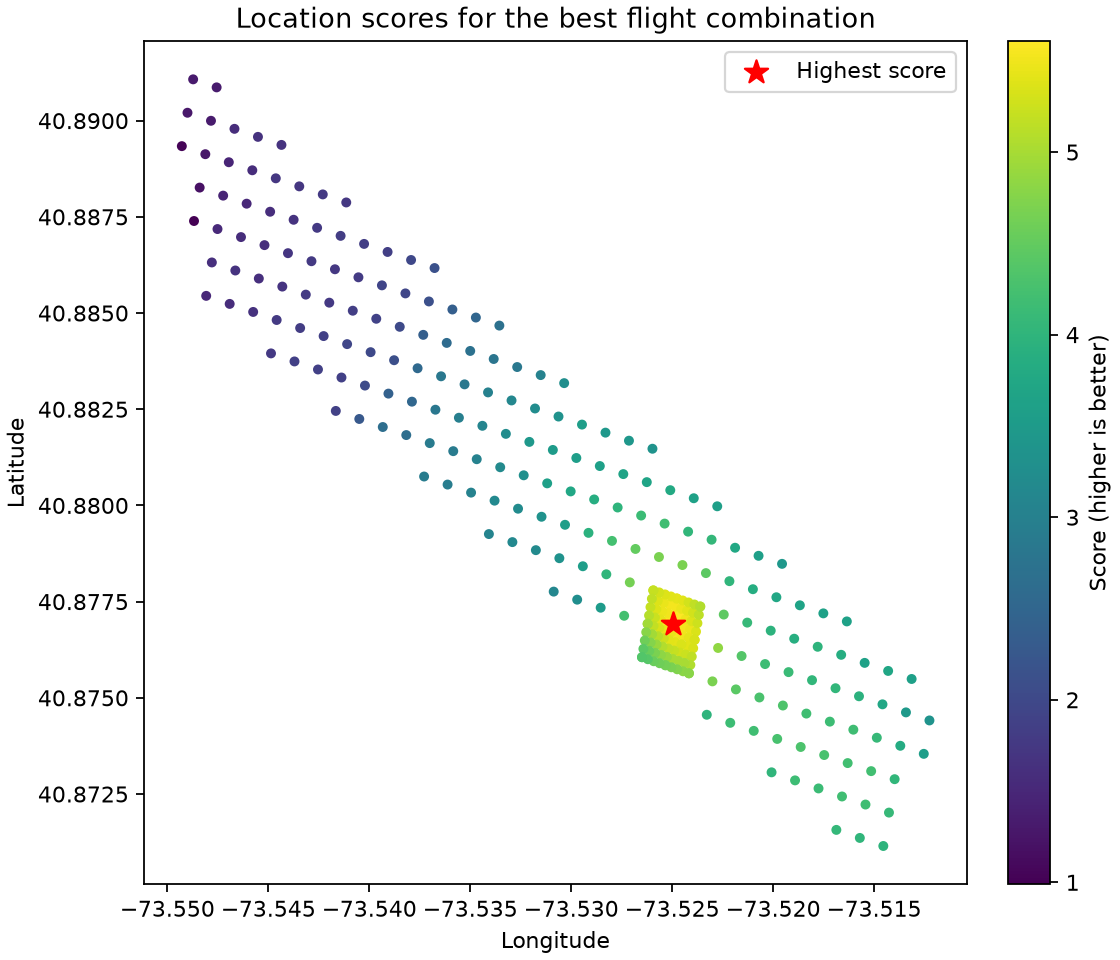
Each point is a possible microphone location. Color shows the fit score; the star marks the highest score.

Read the method
The candidate map
Geographic grid colored by location fit score, with the highest-scoring position marked by a red star
Color encodes fit score, not location probability.
What connects these figures?Understand the method